What is a Chart of Accounts? Types, Definition & Example

Growing businesses with multiple financial accounts face risks such as inaccurate or incomplete financial records, which can lead to a lack of visibility into unprofitable business areas and money flows.
This compounds to poor decision-making, higher fraud risks, and missed tax deductions. To mitigate these risks, forward-thinking companies maintain an index that consolidates all of a company's transactions into a few major categories, offering an accurate, comprehensive view of its financial health. This index is called a chart of accounts.
TL;DR: Key Takeaways on Chart of Accounts
- A chart of accounts is a structured list of all financial accounts. It groups every transaction into clear buckets for assets, liabilities, equity, revenue, and expenses.
- It improves the visibility of financial health. You get fast access to where money comes from and where it goes.
- It supports accurate reporting. You produce cleaner statements and spot issues in spending and resourcing.
- It simplifies tax work. Deductible items stay grouped. Reports align with tax rules.
- It strengthens internal controls. Clear labels help teams trace transactions and flag anomalies. Audits become faster.
- It supports compliance. Consistent categorisation aligns with IFRS, GAAP, and tax codes.
- Building a CoA involves five steps. Define business needs. Pick a numbering system. Categorise accounts. Assign codes. Add clear titles and descriptions. Each new account takes seconds to be added.
- Best practice: use descriptive account names, keep the structure simple, and avoid duplicate accounts.
- Automation improves completeness and accuracy. Automated journal posting reduces manual errors and supports real-time updates.
- Aurum’s Journal module imports data from banks and platforms, applies rules to map transactions to the right CoA category, flags exceptions, and keeps the ledger current.
What Is a Chart of Accounts (CoA)?
A chart of accounts (CoA) is a structured list of all an organisation’s accounts or records of financial transactions. This list provides businesses with an organised framework that lets them categorise all their financial transactions into various accounts, ensuring that transactions are recorded in the correct category.
The company's accounts are grouped by type, typically including assets, equity, revenue, expenses, and liabilities. This way, accountants, investors, shareholders, or anyone interested in knowing can easily understand your organisation's financial health.
For more context, think of a chart of accounts as the table of contents in a book. A table of contents clearly outlines the different chapters and subchapters in a book. Additionally, it is well-numbered, allowing you to navigate to a chapter without needing to read the entire book's content.
Similarly, a chart of accounts is an index that categorises a business's financial transactions into groups of accounts.
How does a chart of accounts work?
Chart of Accounts are ‘buckets’ in your finance system to track spending and all transactions. It organises your financial data into a structured format that is easily accessible, simplifying financial analysis and providing access to key details.
A chart of accounts is mainly divided into five categories:
Assets
An asset is anything a company owns or controls that has financial value or can be used to generate future economic benefits. It’s an essential financial statement of a company’s balance because organisations need assets to operate efficiently.
Some examples of assets include:
- Patents
- Cash
- Inventory
- Accounts receivables
- Equipment, tools, and machines
Liabilities
Liabilities are financial obligations that a company owes to others. This is usually incurred by an organisation while financing its day-to-day business operations.
Some common examples of liabilities include:
- Accounts payable
- Income tax payable
- Banks overdrafts
- Accrued expenses
- Loans
Shareholders’ Equity
Shareholders’ Equity (SE) is an organisation’s total assets or net worth when its total liabilities have been removed.
A quick way to know a company's total shareholders’ equity is to use this formula:
- Total Assets - Total Liabilities = “Shareholder equity”
Some common examples of shareholder equity include:
- Share capital
- Retained earnings
Revenue
This is the money an organisation earns from its day-to-day business operations.
Some common examples of revenue are:
- Operating revenue: sales primarily from a company’s core business
- Non-operating revenue: sales from operations that are not part of a company’s core business. For example, selling old computers and decommissioned IT infrastructures.
Expenses
An expense can be defined as any cost a company incurs in its books. Such a cost is recorded as an expense whether the company uses up its assets or incurs liabilities.
Some of the major types of expenses include:
- Cost of goods sold (COGS)
- Salaries
- Marketing and promotions
- Subcontracts
- Office costs
- Utilities
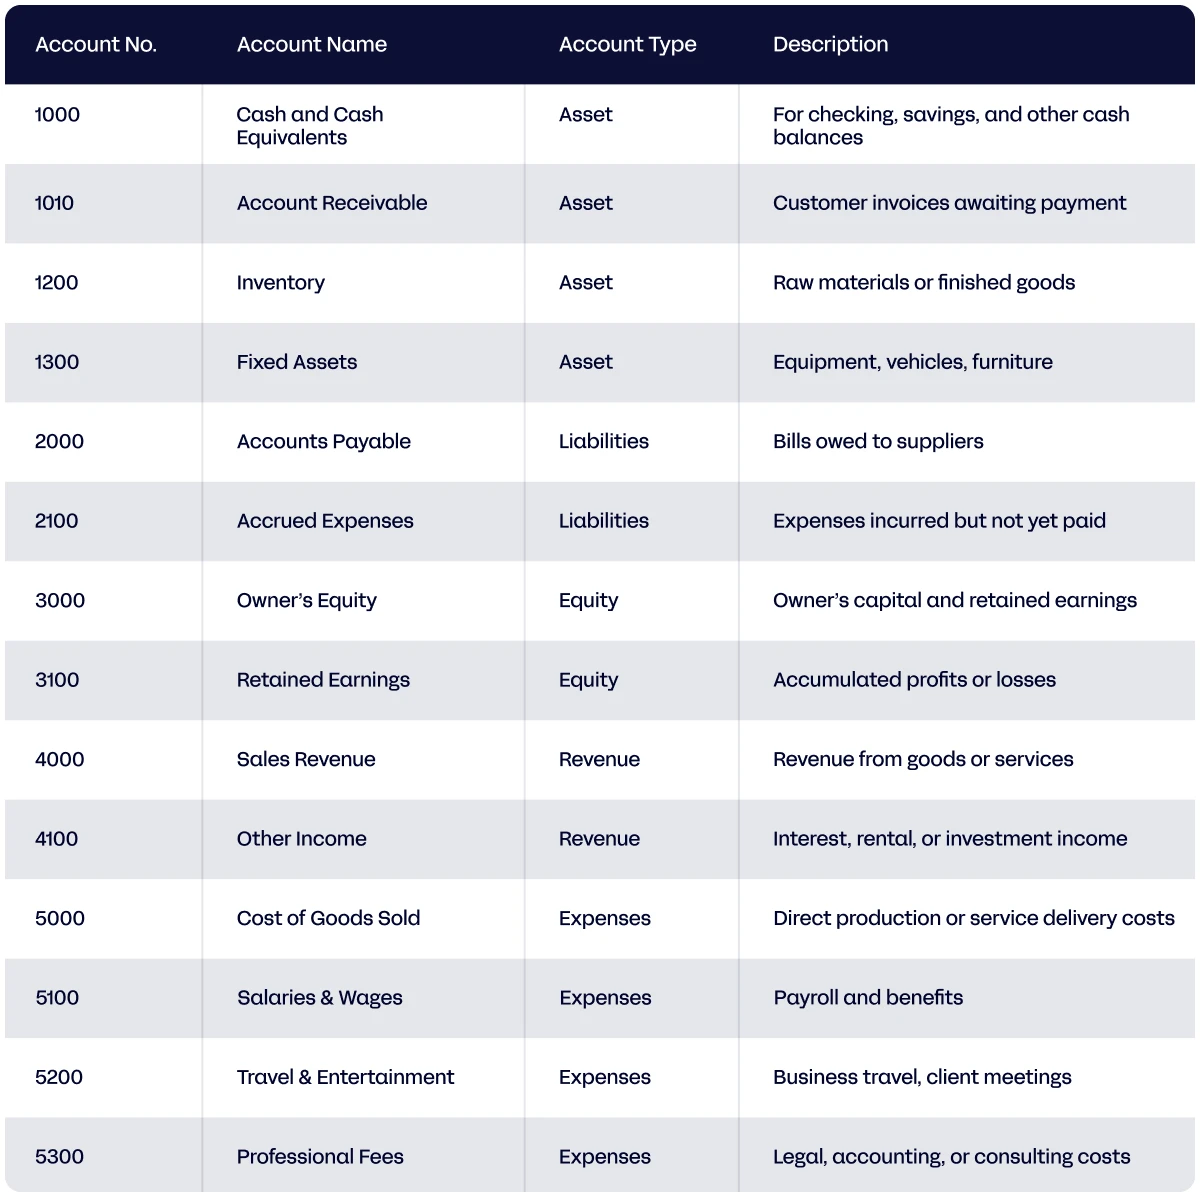
Chart of Accounts Example
A well-structured chart of accounts categorises a company's accounts into major categories, such as assets and expenses, using a consistent numbering sequence and clear descriptions.
Here's an example of a chart of accounts for a small company.
Why is a Chart of Accounts Important?
A chart of accounts provides structure, clarity, and consistency to every financial transaction a company records. Here are some key reasons a chart of accounts matters to companies.
Improves visibility of your financial health
A well-structured chart of accounts consolidates and organises your financial data into distinct categories, including assets, income, expenses, liabilities, and revenue. This makes your accounts accessible.
Additionally, CoA assigns specific codes and numbers to each account, making it easy to classify and locate transactions. This enables key stakeholders to assess your financial health and comprehend cash inflows and outflows of your business.
Facilitates accurate financial analysis and reporting
Having a well-designed chart of accounts also facilitates the preparation of fast and accurate financial reports, which provide stakeholders and investors with a comprehensive overview of your business's financial performance. By having a clear picture of your company's financial performance, you can identify areas that need better resource allocation or where you need to minimise your expenses.
Additionally, a chart of accounts allows you to create accurate and customised financial reports, highlighting some key areas in your business.
Makes tax preparation easier
Having a well-structured chart of accounts streamlines your tax preparation. It categorises and labels your deductibles, making it easy for you to identify them when preparing for tax season.
A chart of accounts helps you file taxes faster because you spend less time sorting and matching your financial transactions. Your expenses and income are properly grouped and categorised throughout the year, making it easier to generate reports that align with your tax requirements.
Supports internal controls and audit
Another significant advantage of having a chart of accounts is that it simplifies tracing the flow of money through all your business accounts. Each account is labelled correctly, which makes reviewing them less of a hassle.
On the auditing side, categorising every transaction helps you to spot and flag discrepancies and unusual transactions. There’s an audit trail for internal auditors to trace and verify whether or not a financial transaction is fraudulent or legitimate.
Ensure compliance with regulatory requirements.
While the CoA itself doesn’t automatically make a business compliant, it creates the framework that ensures transactions are recorded, categorised, and reported consistently in line with legal and accounting standards. This is important for companies that want to stay compliant with International Financial Reporting Standards (IFRS) and other regulatory requirements, such as GAAP and tax code.
How to Prepare a Chart of Accounts: Step by Step
Here’s a walk-through on how you can prepare a chart of accounts from scratch:
Understand your business needs
Your business's structure, industry, model, size, and the types of expenses it incurs will dictate the types of accounts you need. And this will, in turn, define what your chart of accounts would look like.
Choose a numbering system
You can number accounts in a chart of accounts sequentially by assigning a range of numbers for each category. For example, 1000-1999 for Assets and 2000-2099 for Liabilities.
Another numbering system is the hierarchical system, which is particularly useful for organisations with more complex business operations. This numbering system is more granular, breaking accounts into subcategories—for example, 1000 for Non-current Assets and 1100 for Current Assets.
Categorise your accounts
Once you’ve chosen a suitable numbering system, the next step is to break your accounts into five main categories:
- Assets
- Liabilities
- Equity
- Revenue
- Expenses
Accounting software can categorise accounts based on the records in your ERP.
After that, create sub-categories that are relevant to your business operations under the main categories. For instance, under Liabilities, you might create sub-categories for Accounts Payable, Short-term Loans, and Bank Overdrafts.
Assign numbers to each account.
Assign numbers to each account based on the numbering system you’ve chosen. Begin with the broad categories and assign a specific range of numbers to each major category. For example, Assets can take the range of 1000-1999, while Liabilities fall within the range of 2000-2999.
Ensure that you space your account numbers adequately to leave sufficient space within each category. This way, you can leave room for new accounts in the future.
Accounting software can automatically generate account codes, preventing duplication and gaps in numbering.
Provide details to each account.
For each account, ensure that it has a clear title and a brief description that outlines its purpose.
Additionally, make sure everyone involved in bookkeeping and financial management has a clear understanding of these titles and descriptions. For example, the description for an account named “Expenses” can be, “Costs of business-related transactions, like costs of goods, ground transportation, marketing, and advertisement”.
Implement and review periodically
Create your new chart of accounts in your accounting software. Most accounting software would create a standard CoA for you. You can customise it, delete the accounts you don’t need, and create new ones.
Once you are done, save your CoA and regularly update it as your business grows.
Chart of Accounts: Best Practices
Observe these best practices to maintain a comprehensive chart of accounts without being overwhelmed.
Use descriptive account names
Avoid using generic or vague account names; instead, use names that are as descriptive and clear as possible.
For example, “travel expenses” is much more specific than a generic name like “other business expenses”. The first name indicates the particular expense the account is used for, while the second one is vague and leaves room for confusion.
Keep it simple
Having a simplified CoA makes it easy to manage and audit. Not only that, but it also reduces the chances of coding errors, which can lead to errors in reporting.
On the other hand, having too many duplicate accounts and an inconsistent numbering system can make auditing and reconciliation complex and time-consuming.
Use modern accounting software
Most modern accounting software automatically groups and categorises your business accounts. This serves as a starting ground where you can customise the default template and remove the accounts that are not relevant to your business. A feature like this saves you time and energy that would have gone into doing it manually.
Using accounting software reduces the need to duplicate accounts in your CoA. Instead of duplicating accounts, you can tag transactions, which makes your CoA lean, cleaner, and organised.
Keeping a Comprehensive Chart of Accounts with Automation
Manually recording transactions and matching them to the proper accounts and CoA reference numbers is time-consuming and becomes increasingly complex as your business grows. By automating journal posting, you can have a more comprehensive and up-to-date CoA.
“A comprehensive Chart of Accounts is the backbone of accurate reporting, stronger decision-making, and smoother audits—but it’s also a simple way to truly understand where your money is earned and where it’s spent, giving you deeper control and confidence in your business.”
Paulo Andrade, Senior Delivery Manager, Aurum Solutions
With automation, your finance team can post more regularly to your CoA and track things more granularly, letting your CoA grow with your business as maintaining complete and well-categorised transactions becomes more complex.
By automating journal files, companies eliminate manual bottlenecks, improve scalability, and streamline the month-end close process. For example, you should have every company account in your CoA so you can track it in your finance system.
“Standardising the logic behind vendor, department, cost centre, and transaction-type mapping ensures the business is getting consistent and reliable financial information, leading to fewer reclassifications/adjustments and cleaner ledgers. That accuracy transforms the decision-making process - giving the business sharper insights and the confidence to act decisively.”
Paulo Andrade, Senior Delivery Manager, Aurum Solutions
How Aurum's next-gen reconciliation software can help you build an up-to-date CoA
With over 600 ready-to-use integrations, Aurum’s journal posting automation automatically imports data from sources like banks, payment providers, and trading platforms.
It matches transaction data to CoA categories using predefined rules, allowing you to maintain an efficient financial record-keeping process without compromising accuracy.
Aurum’s Journal module links directly to your chart of accounts, automatically categorising and posting transactions to your ledger. Any transactions associated with new or unconfigured accounts are flagged for review, ensuring your chart of accounts stays accurate and up to date. This delivers real-time cash visibility, reduces manual effort, minimises data-entry errors, and strengthens overall financial control and audit readiness. (Dylan Bird - Head of Professional Services at Aurum Solutions)
CTA: Learn how your business can automate reconciliation processes to save time and improve accuracy.
As Aurum Solution’s CMO, Vasco Vaz Rodrigues heads up the marketing department and oversees the generation of original insights for financial professionals. Paired with Aurum’s ability to optimise their time, marketing output therefore ensures that the Aurum Solutions brand provides more than just software but holistically empowers entire finance teams.